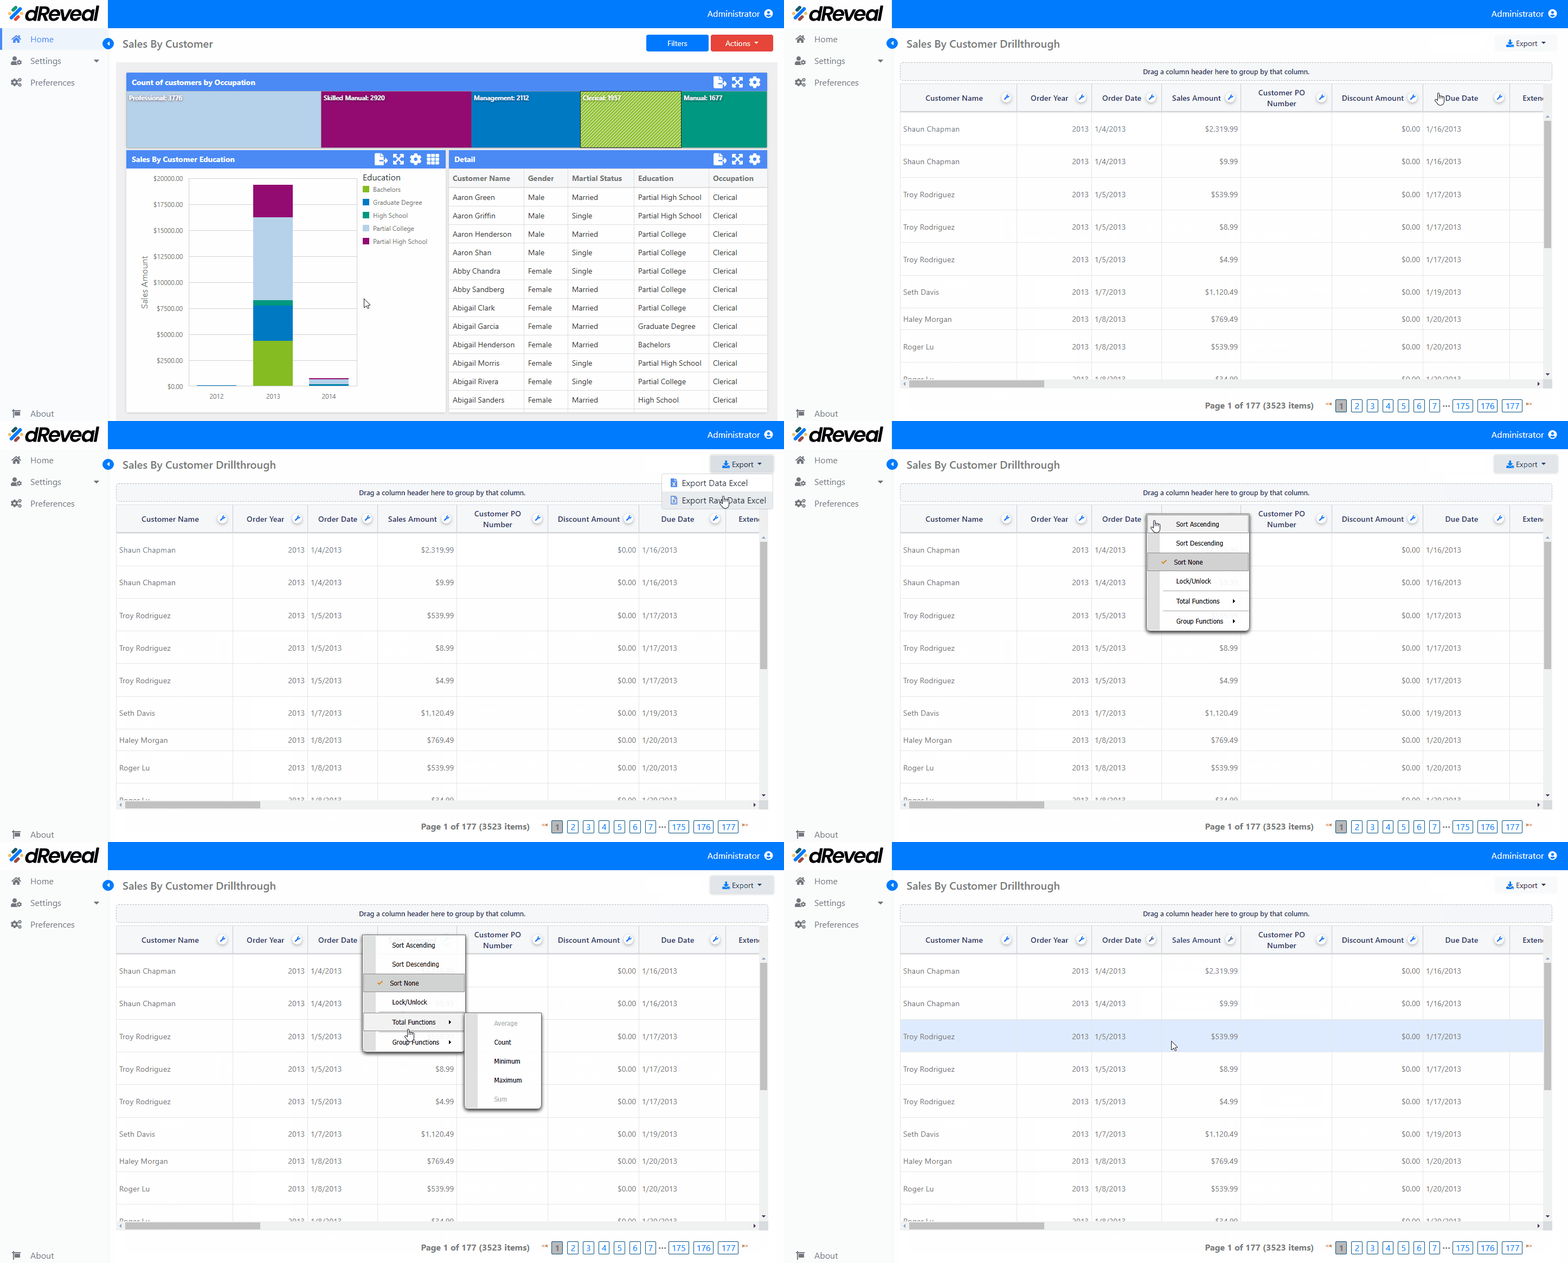
Drill-Through
Drill-Through is a type of grid report configured within a dashboard report. It allows users to view more detailed and specific information about a chart element or the entire chart. The Drill-Through report will open in a new browser tab.
There are two ways to access the "Drill-Through" of a chart:
- Drill through all: By clicking the icon located in the top right corner of the chart, a detailed view of all the chart's elements will be displayed.
- Drill through element: By clicking on a specific element of the chart, a detailed view of that element will be displayed.
The "Drill-Through" feature benefits the end user in the following ways:
- It allows users to explore specific information related to a particular element or the entire chart, delving into details that are not available in the main visualization.
- It provides additional context by displaying complementary or related information about the selected element or the entire chart.
- It enhances the user experience by offering interactivity and the ability to navigate information intuitively.
Note: The types of charts that can be configured with Drill-Through are: Bar, Line, Tornado, Pie, Scatter, Cards, and Pivot.
How to Open a Drill-Through
To open a Drillthrough, first enter your username and password, then click the Login button. Once logged in, navigate to the report you want to run and double-click on it to open. Next, click the Apply button to display the report. Once the report is loaded, click on the icon located in the top right corner of the chart, and a detailed view of all the chart's elements will be displayed. Alternatively, click on a specific element of the chart, and a detailed view of that element will be shown.
Drill through all

Drill through element

